Infographics

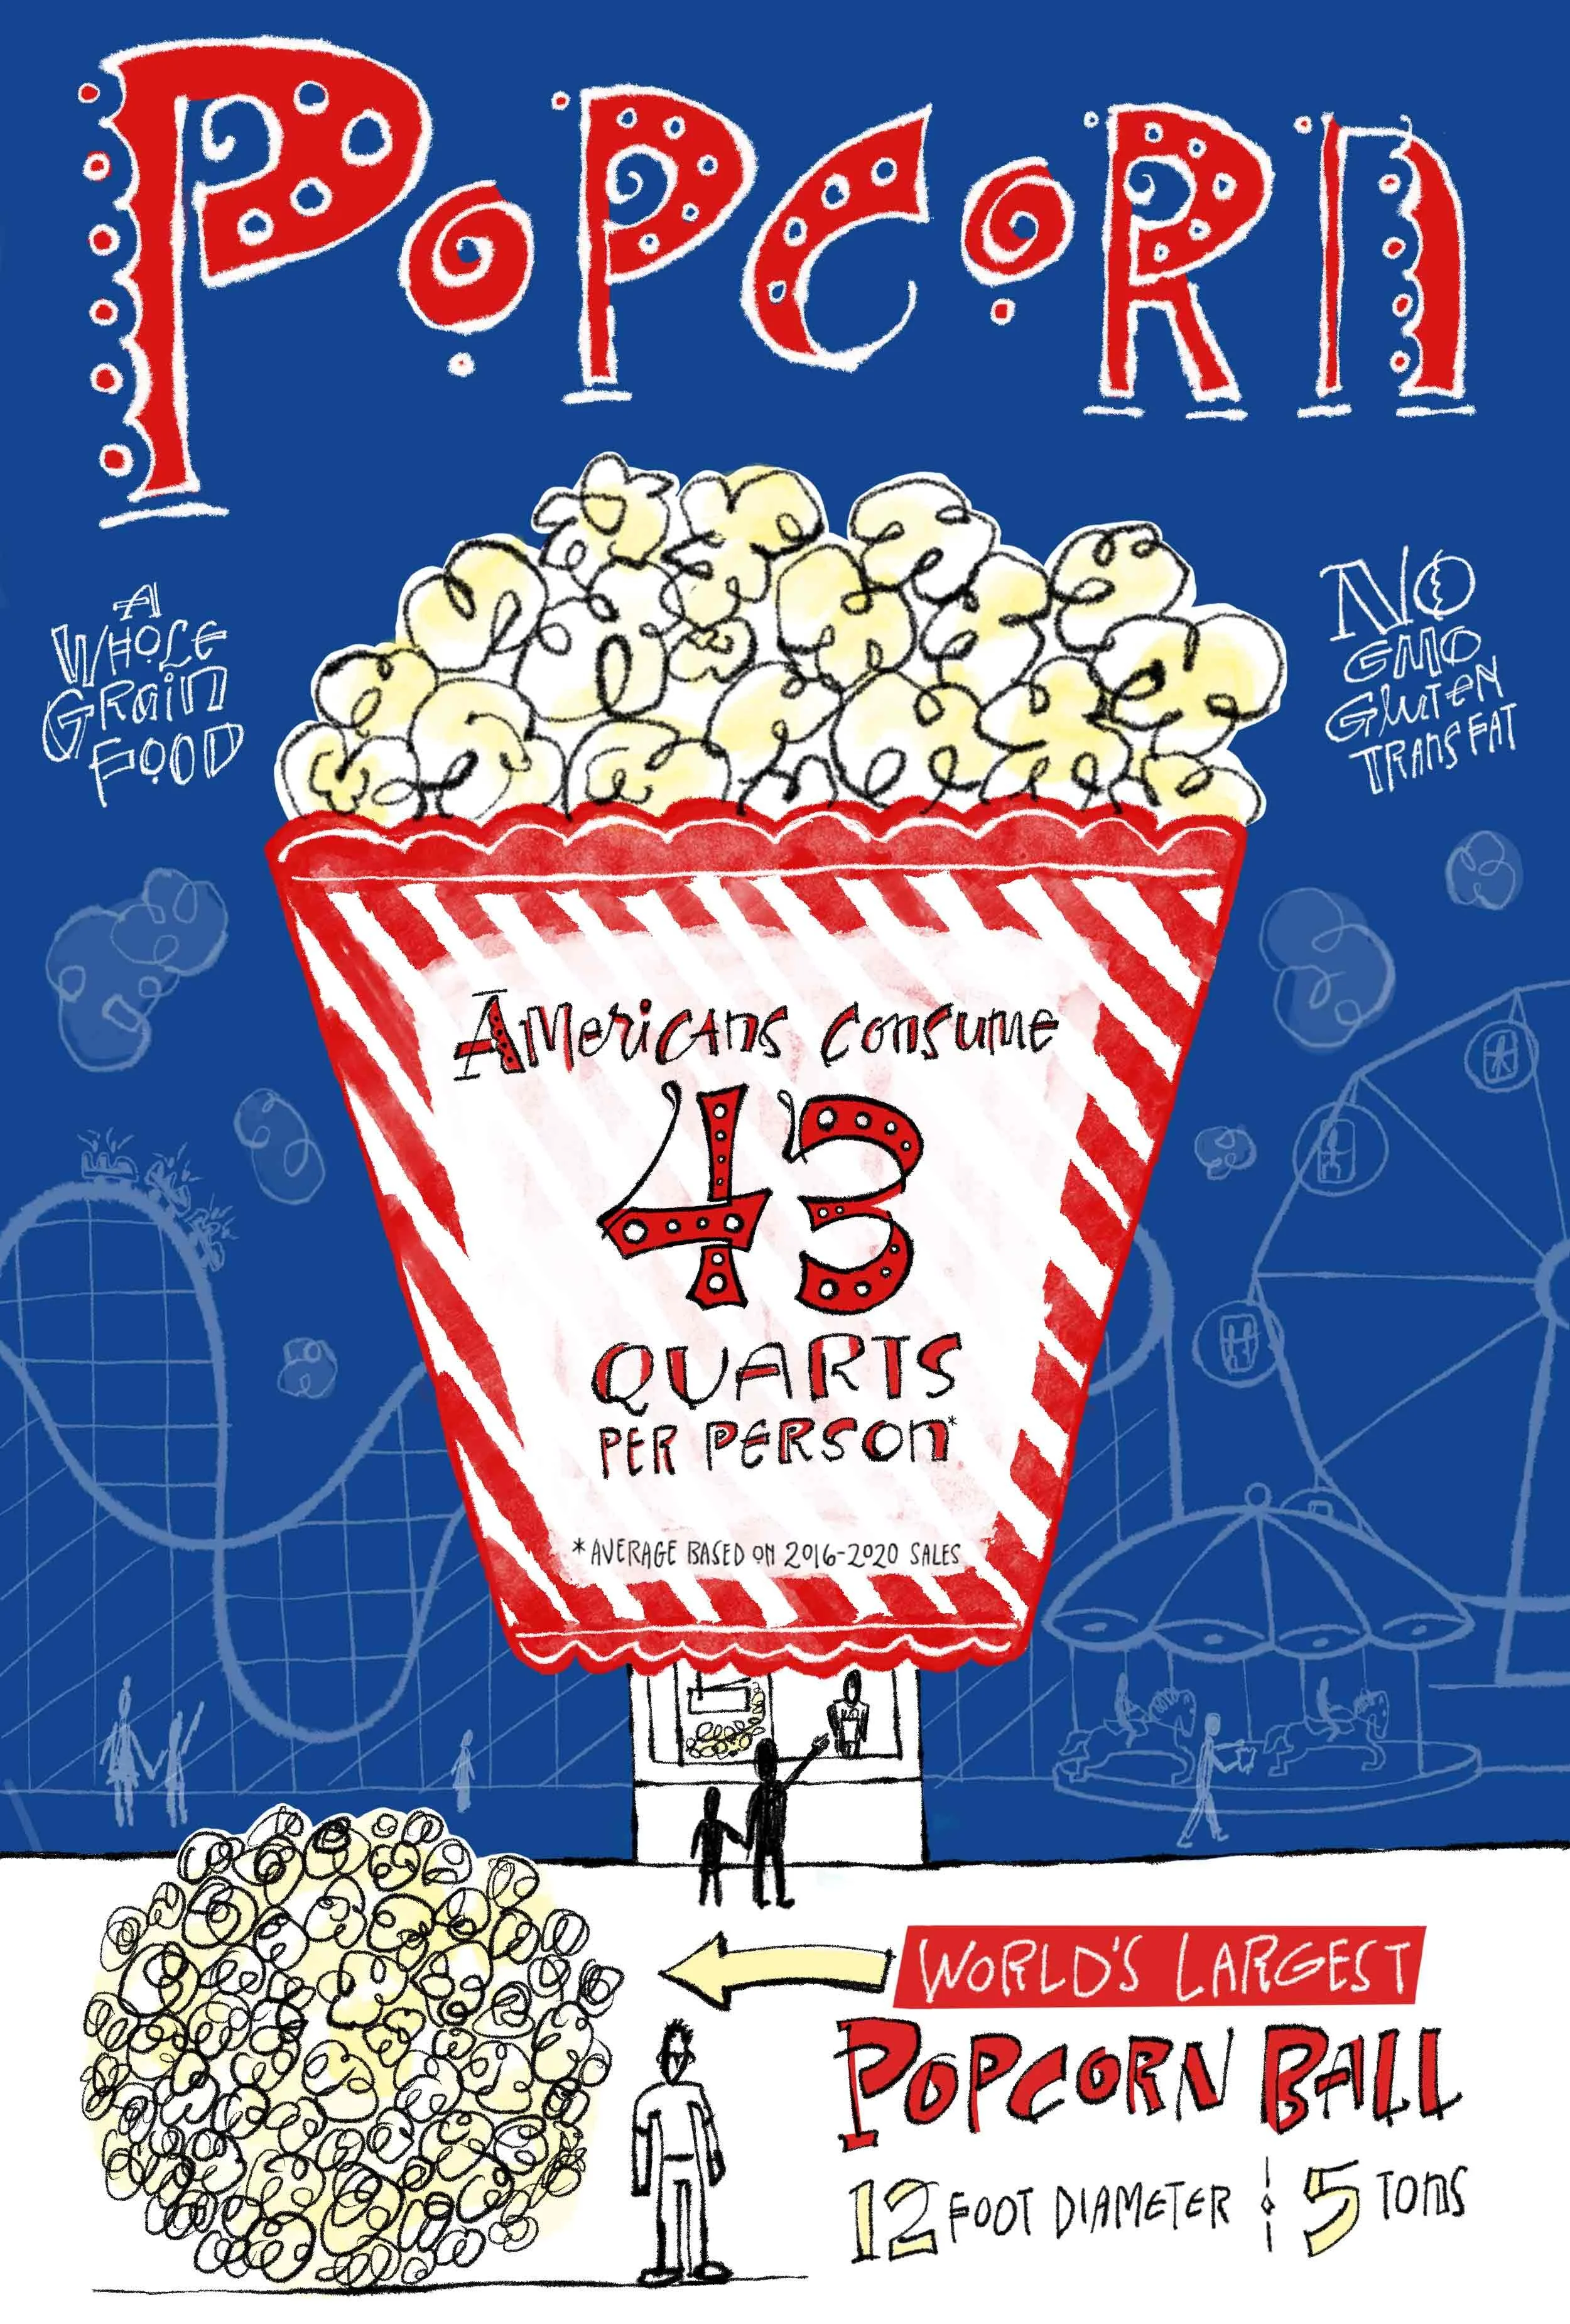
Using a combination of hand lettering, illustration, and typography.
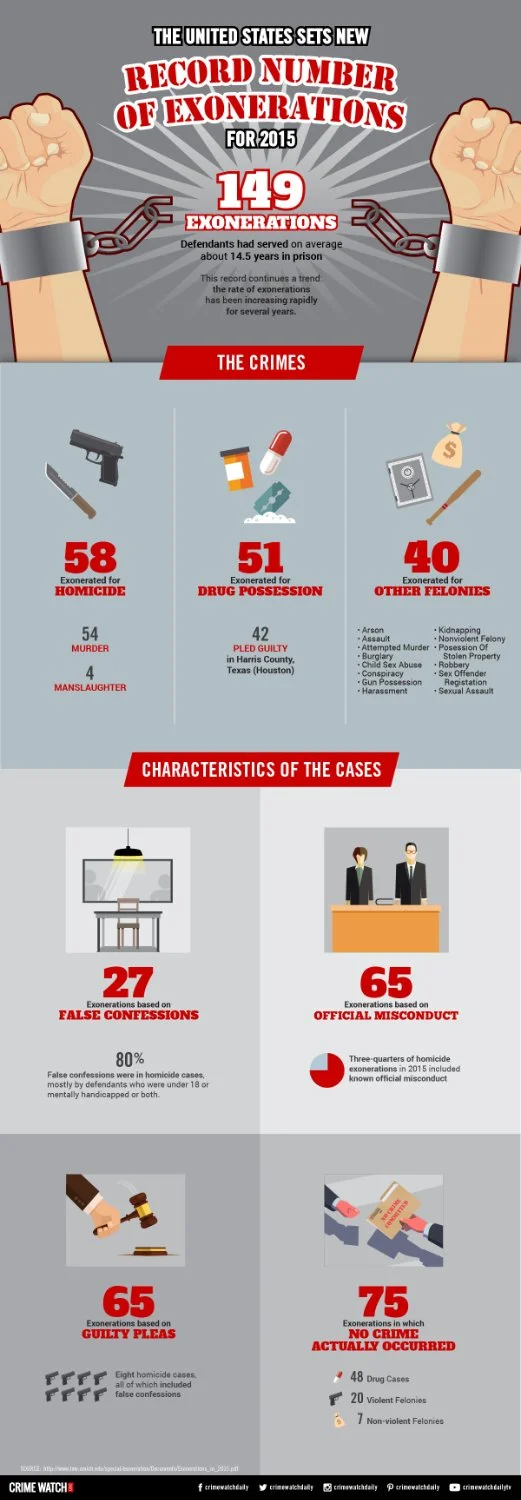
He reviews primary sources for facts about his subjects. His work complements editorial content in print and digital media.

As an illustrator and designer he works closely with art directors, producers, writers and editors to create infographics for regional and national television audiences. He partners with senior leadership from higher education institutions and non profit organizations for data visualization design.

Email me at alex@alexsavakis.com

Infographic detailing TSA behavior checklist for identifying potential terrorists, with outlined behaviors like avoiding eye contact and excessive head-turning. Also lists unusual items like blueprints, GPS, or excessive liquid possession. Produced by Crime Watch Daily.
Infographic titled 'The United States Sets New Record Number of Exonerations for 2015' showing 149 exonerations. It highlights types of crimes: 58 for homicide, 51 for drug possession, and 40 for other felonies. Characteristics of cases include 27 based on false confessions, 65 on official misconduct, 65 on guilty pleas, and 75 where no crime occurred. "Crime Watch" logo at the bottom.
Infographic titled 'Black Friday Death Count' showing deaths and injuries from 2006 to 2014. Map highlights California, New York, North Carolina, and West Virginia with death counts. Descriptions of incidents and totals: 7 deaths, 97 injuries. Causes include pepper spray, tramplings, car accidents, assaults, shootings, and stabbings.